The money series
Climate Action Index · October 2026
Where the money goes
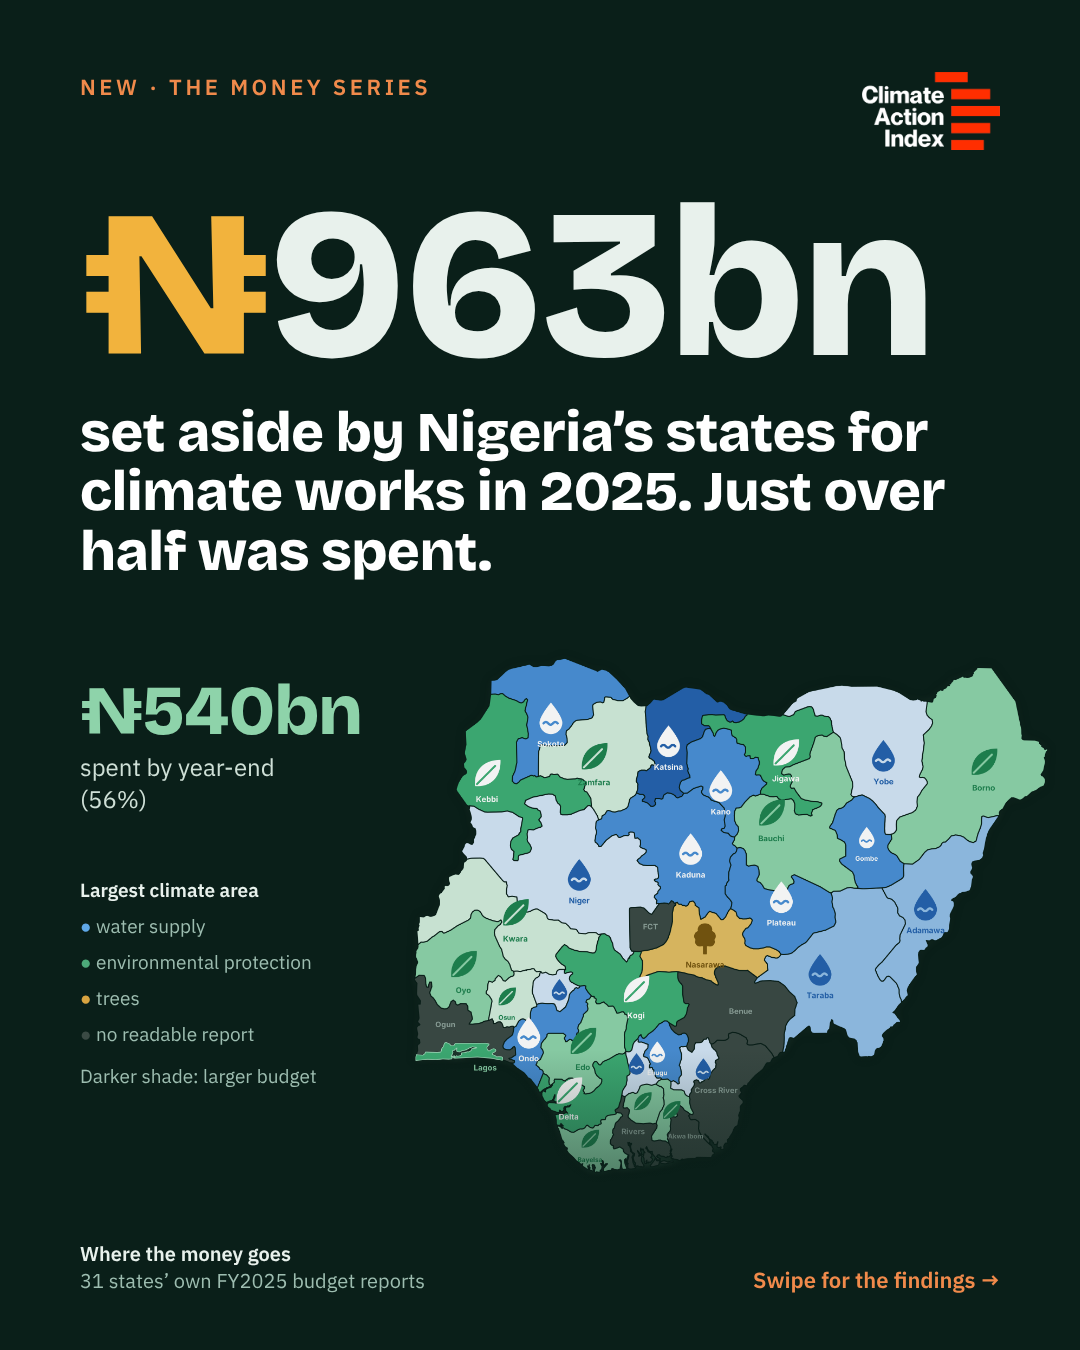
Nigeria's states set aside ₦963 billion for climate works in 2025. Just over half was spent.
31 states set aside ₦963 billion for climate-related capital works in 2025. By year-end they had spent ₦540 billion. Most of it went on water supply and environmental protection; trees received about 1%.
Evidence period FY2025 (to 31 December 2025) · 31 of 37 jurisdictions · 11 pages
At a glance
Climate money is a small slice of state capital budgets. Just over half of it was spent, and nearly half is filed under a heading that says little.
₦963bn
Budgeted for climate-related capital works in 31 states
The capital money these states classify under water supply, environmental protection, waste, pollution, street lighting, forestry and biodiversity.
5.9%
Of the same states' combined capital budgets
Climate-related functions made up 5.9% of a combined capital budget of ₦16.4 trillion. The share ranges from 0.8% to 17.7% across states.
56%
Recorded as spent by year-end
₦540bn of the ₦963bn was recorded as spent. 18 of 31 states spent less than half of their climate budget; 8 spent less than a quarter.
47%
Filed under a heading that says little
₦451bn sits under “environmental protection, not elsewhere classified”, a residual heading. Where it can be traced it is mostly drainage, erosion control and dredging.
Figures describe what states' own reports record. They are not total climate spending in Nigeria and they do not rank states. Electricity (₦543bn budgeted) is reported separately, below.
Finding 1
Two areas take 94% of the money: environmental protection and water supply
Every Nigerian state reports its capital spending by government function, using the same international classification. That gives one consistent basis across 31 states. Together the climate-related functions were budgeted at ₦963bn. The share of capital spending varies widely, from 0.8% to 17.7%, with half of states below 3.9%. Lagos alone accounts for 23% of the total, reflecting the size of its budget.
- Environmental protection, not further specified₦451bn
- Water supply₦380bn
- Waste, waste water and pollution₦70bn
- Street lighting₦50bn
- Trees, forests and biodiversity₦12bn
Width of each bar = share of the ₦963bn budgeted for climate-related capital works, 31 states, FY2025. Functional classification (COFOG) codes 70511, 70521, 70531, 70541, 70422, 70561, 70631 and 70641. Delta's published functional table repeats its overhead figures, so its full project list was classified instead. Source: state FY2025 budget implementation reports; CAI analysis.
Finding 2
Just over half was spent, and most states spent less than half
By year-end the 31 states recorded ₦540bn of climate-related capital spending against ₦963bn budgeted: 56%. Street lighting, a visible and quick purchase, was the most fully spent area. Trees, forests and biodiversity, the smallest, was the least.
- Environmental protection, waste and pollution₦306bn of ₦521bn59%
- Water supply₦193bn of ₦380bn51%
- Street lighting₦39bn of ₦50bn78%
- Trees, forests and biodiversity₦2bn of ₦12bn17%
Source: state FY2025 budget implementation reports; CAI analysis.
What the records show
Seven findings from the states' own reports
01
Two areas take 94% of the money
Environmental protection, waste and pollution (₦521bn) and water supply (₦380bn) make up 94% of the total. Each is the largest climate area in 15 states. Street lighting takes 5%; trees, forests and biodiversity just 1.3%.
02
Nearly half the money is hard to see
₦451bn is reported only as “environmental protection n.e.c.”, a residual heading. The project lists show that, where it can be traced, it is mostly drainage, erosion control and dredging. In nineteen states there is no project list to check against.
03
Spending lagged budgets in most states
18 of 31 states spent less than half of their climate budget; 8 spent less than a quarter. Trees and biodiversity fared worst: 17% spent. Low figures can reflect late releases, projects carried into 2026, or donor-financed works recorded outside the state's books. The reports do not say which.
04
Big lines move; small local lines mostly do not
In the 12 states that publish full project lists, 62 lines of ₦1bn or more hold 83% of the money. Of 468 lines under ₦50m, where village boreholes and ward drains sit, 73% recorded no spending. Across all climate lines in those states, 59% recorded no spending at all.
05
Donor-backed works often show no spending in the state's own record
Several of the largest lines that recorded nothing are co-financed by development partners: the Owena Dam scheme in Ondo (African Development Bank and French Development Agency) and the Jos–Bukuru erosion works in Plateau (NEWMAP and ACReSAL, both World Bank-supported). Together they carry ₦46.2bn of budget and recorded ₦0.06bn of spending.
06
The record does not say who the money is for
None of 888 climate project lines states how many people a work is meant to serve. The only people counted anywhere are flood victims in three Adamawa relief lines, and none of those recorded spending.
07
Most states do not publish what they built
Only 12 states published a complete list of 2025 capital projects; six jurisdictions had no full-year capital report we could read. Without the list, a reader can see that a state budgeted for “water supply”, but not which towns, how many boreholes, or whether any were finished.
Finding 3
What each jurisdiction's 2025 report lets a reader see
12
Full project list, reconciled to the capital total
4
Partial project list
15
Functional totals only, no general project list
4
Report found but capital tables not usable
2
No full-year 2025 report found
One document per state or the FCT. Akwa Ibom (summary pages only), Benue (tables not machine-readable), Cross River (functional table columns do not add up) and Ogun (only a mid-year report found) are unusable; no full-year 2025 report was found for Rivers or the Federal Capital Territory. Searches covered state government and budget websites and the Open Nigeria States repository, up to October 2026.
What states can do
Publish the full capital project list in every quarterly report, with location, implementing agency, budget, release and spending. Mark donor-financed lines and record their spending, even when funds go directly to contractors. Add, for each climate-related project, the number of people or the area it is meant to serve.
Kept out of the climate total
Electricity: ₦543bn budgeted, reported beside the climate figure
State electricity spending is large and mixed: grid extension and transformers, solar lights, and generators. Depending on the source of power, it may raise or lower emissions. Counting it as climate spending would raise the headline by more than half and blur what the climate figure means. We therefore report it beside the climate total, not inside it. In the same 31 states, ₦300bn of the ₦543bn was recorded as spent (55%).
Method, checks and limits
How the figures were built, and what they cannot tell you
Sources
The full-year (fourth-quarter) 2025 budget implementation reports of 31 states, published on state websites or the Open Nigeria States repository, read in full. Six jurisdictions are not covered: Rivers and the FCT (no full-year report found), Akwa Ibom (summary only), Benue (tables not machine-readable), Cross River (functional table does not add up) and Ogun (mid-year report only).
Functional view
Each report includes a table of capital expenditure by function (COFOG). We took codes 70511 waste management, 70521 waste-water management, 70531 pollution abatement, 70541 biodiversity, 70422 forestry, 70561 environmental protection n.e.c., 70631 water supply and 70641 street lighting. Electricity (70435) and non-electric energy (70436) are reported separately.
Amount checks
A figure is used only when the budget and spending columns reproduce the report's own performance percentage to within 0.15 points, or, where spending is zero, the balance equals the budget. All 31 states' climate function rows pass.
Project view
Twelve states publish complete project lists that reconcile to their capital totals. Each line was coded to the same areas by published rules. Two independent AI-assisted checks, each blind to the rules, coded random samples. The first (250 lines) agreed on 88% (Cohen's kappa 0.83); rules were then corrected for water-and-sanitation agencies. The second (300 lines, all tree lines included) agreed on 90% (kappa 0.88), and on 94% of the 247 lines the checker was sure of. Its disagreements were reviewed and the rules corrected; the figures here use the corrected rules.
Limits
Functional codes record where states file spending, not what it achieves; “environmental protection n.e.c.” may include items with no climate purpose, and climate-relevant works filed under roads or agriculture are not counted. Recorded spending is what reports state, not verified delivery.
The money series
What follows
The Climate Action Index follows public climate money in Nigeria's 36 states and the Federal Capital Territory, using each government's own published records. CAI does not rank states on these figures.
- 01Where the money goes
- 02Trees and vegetative cover
- 03Lights, not households
- 04Budgeted, not spent
- 05Self-report versus the record
- 06A publication checklist for states
- 07Policy by template
The data behind this report
The state-level dataset for this report, with every amount check and the project-line coding, is available on request.
Prepared by the Climate Action Index, a research initiative of the Centre for Climate Action, Innovation and Engagement (CCAIE).
Evidence period FY2025 (to 31 December 2025). Published October 2026.
climateactionindex@gmail.com